The same figures, pinned to the sheet instead of hung in it. Six come from the case studies with their captions and scopes untouched; three are studies I redrew after pinned references, and they are not results.
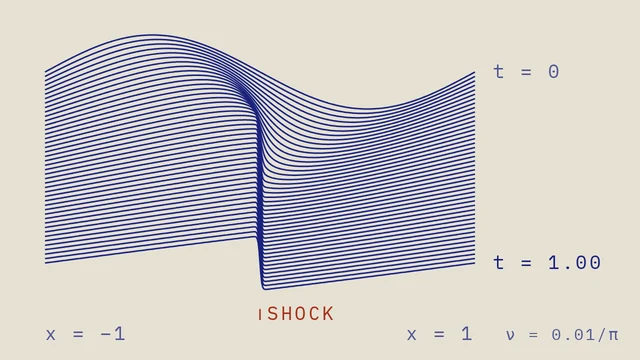
Fig. 1Burgers’ equation with ν = 0.01/π, drawn one time slice at a time: the sine wave steepens into a shock at x = 0. Exact solution by the Cole–Hopf transform, computed for this figure. It is the benchmark PINNs are fitted to, not output from the repository’s networks. From Physics-Informed Neural Networks.
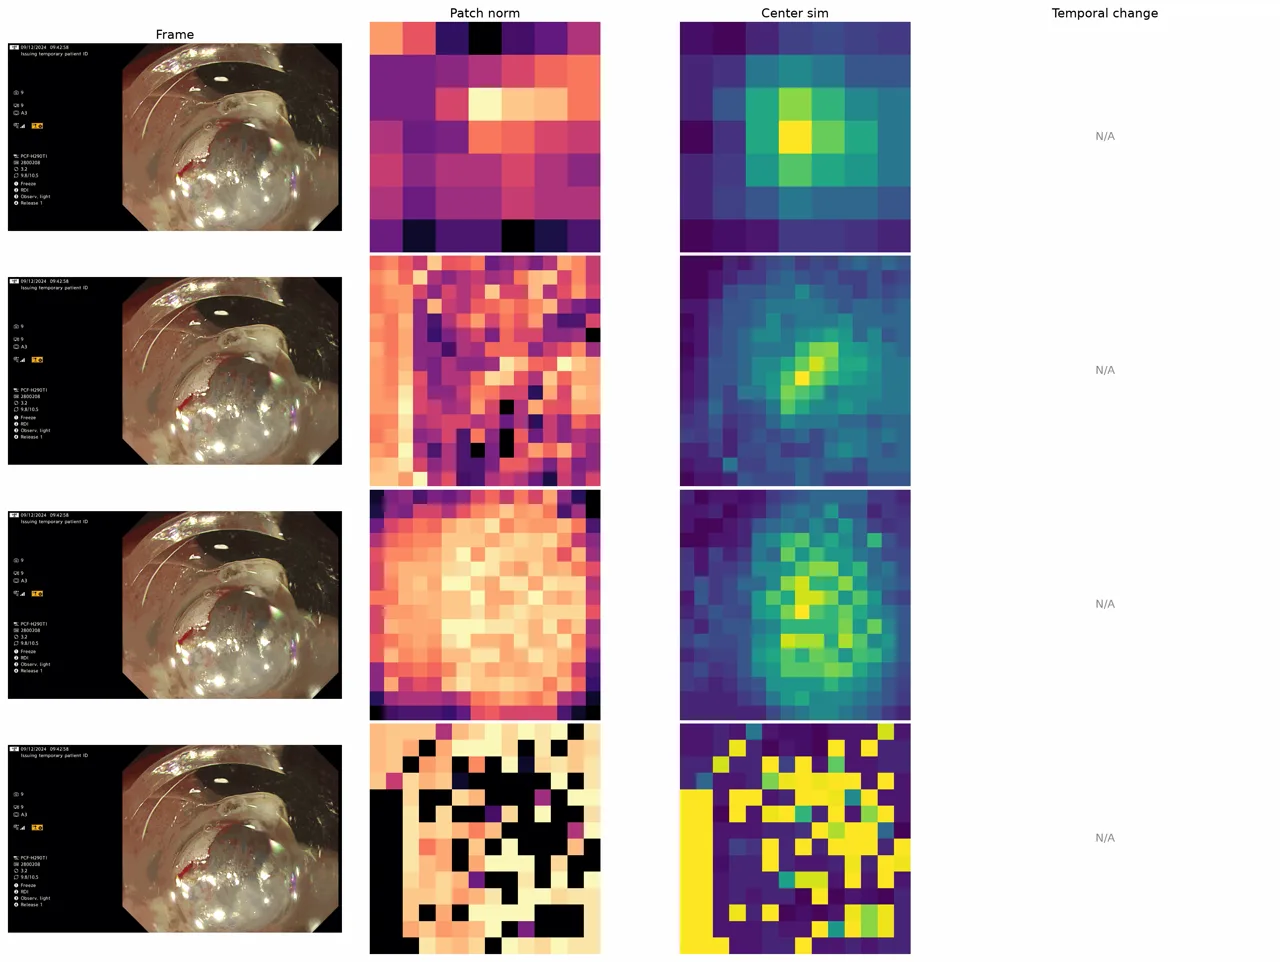
Fig. 2DINOv2 feature diagnostics across an endoscopic submucosal dissection sequence. Selected frames from one ESD sequence. From AIMS: Surgical Phase Detection.
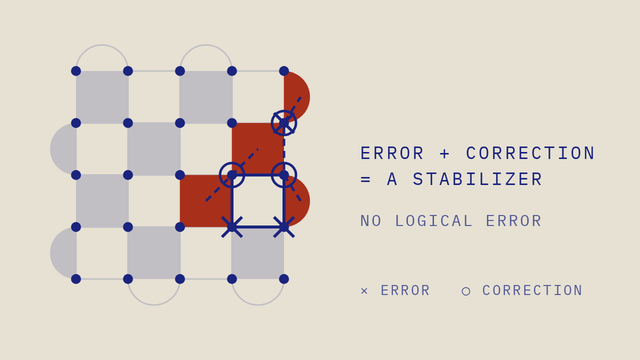
Fig. 3A decoder sees only the four lit checks, and its correction differs from the errors yet cancels them. An illustrative error pattern on a d = 5 rotated surface code. The matching is an exhaustive minimum-weight pairing computed for this figure, not Stim or PyMatching output. From Quantum Error Correction.
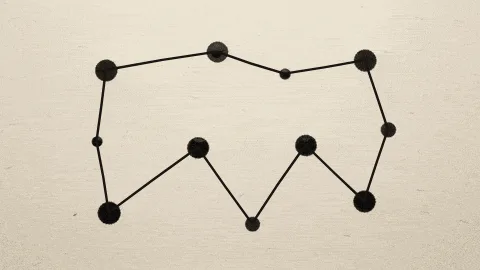
Fig. 4A tangled tour through eleven dots shortens, one swap at a time, into the shortest loop. The tour is computed by a 2-opt search over these eleven points, not by the paper’s Hopfield network. The final loop is the optimal tour for them. From Hopfield Networks & TSP.
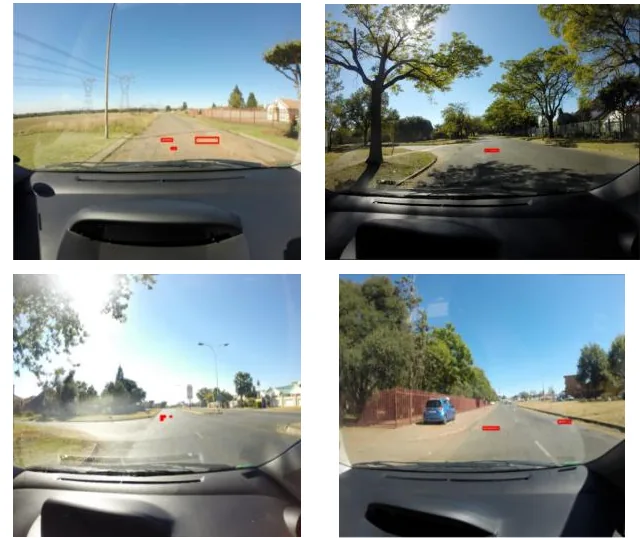
Fig. 5Sample dashcam frames from the PNW set, with the labelled potholes marked. Figure 1 of Rout et al., arXiv:2401.08588. The boxes are the dataset labels, not model output. From Pothole Detection (arXiv).
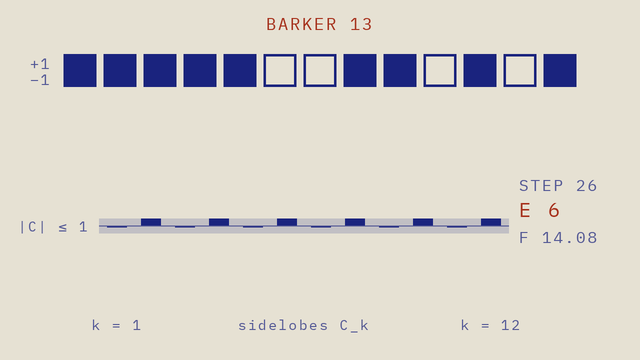
Fig. 6Tabu search on the 13-bit LABS problem, one flip a step, from energy 302 down to 6: the Barker sequence. A classical tabu search from a random start, computed for this figure. In the team’s workflow, CUDA-Q samples seed the classical search instead. From iQuHACK 2026 NVIDIA LABS.
Fig. 7Study I — a spiral tunnel, redrawn after a pinned reference. A drawing exercise from geometry. Not a result from any project.
Fig. 8Study II — wave lines, redrawn after a pinned reference. A drawing exercise from geometry. Not a result from any project.
Fig. 9Study III — a circuit tree, redrawn after a pinned reference. A drawing exercise from geometry. Not a result from any project.
Six figures kept with their captions and scopes. Three studies, drawn from geometry.